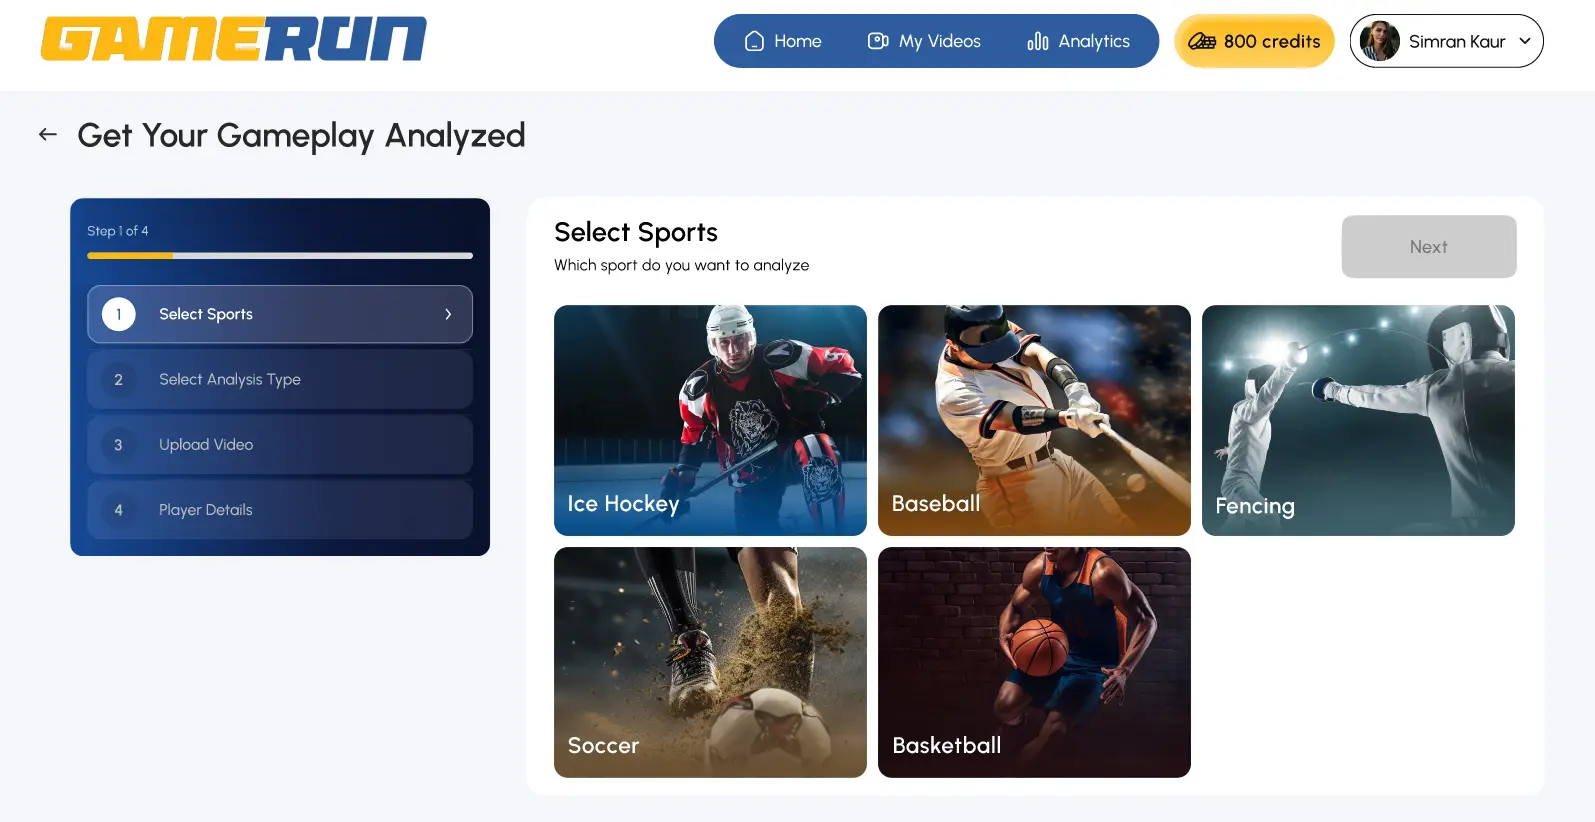
GameRun Web Platform
Our redesigned web platform offers a modern, high-performance experience with clarity, speed, and seamless navigation on any device.
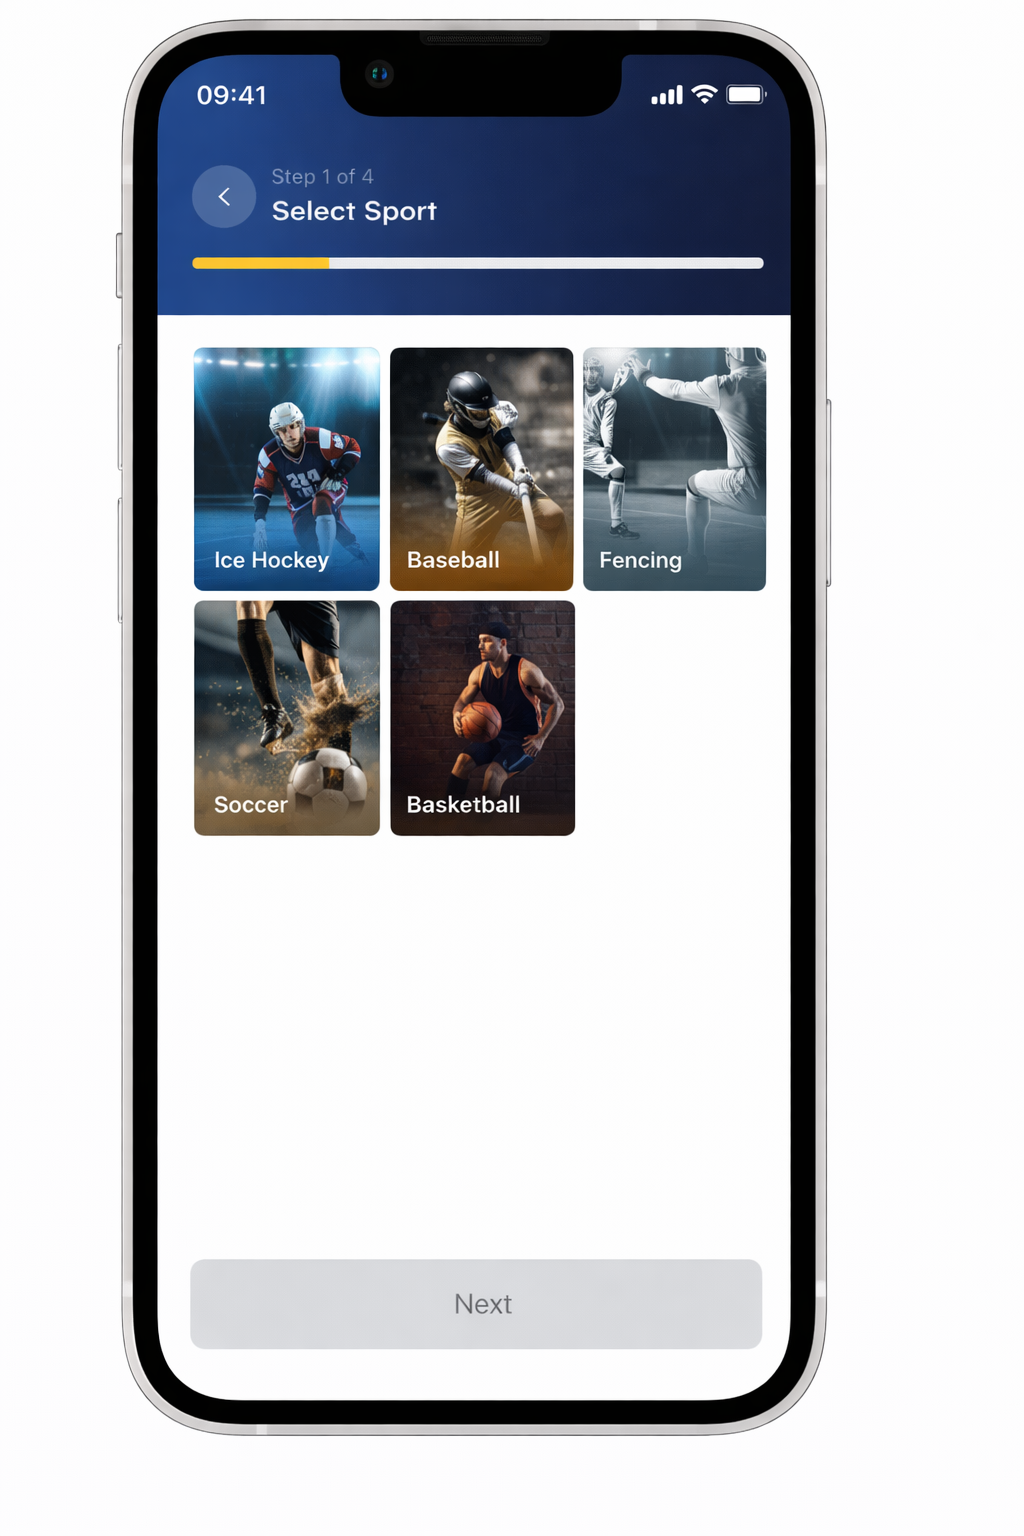
GameRun Mobile App
See how athletes upload videos, get instant performance breakdowns, and receive data-driven insights to improve faster and train smarter.
Performance Analysis
Access detailed reports with key metrics and actionable insights for every athlete.
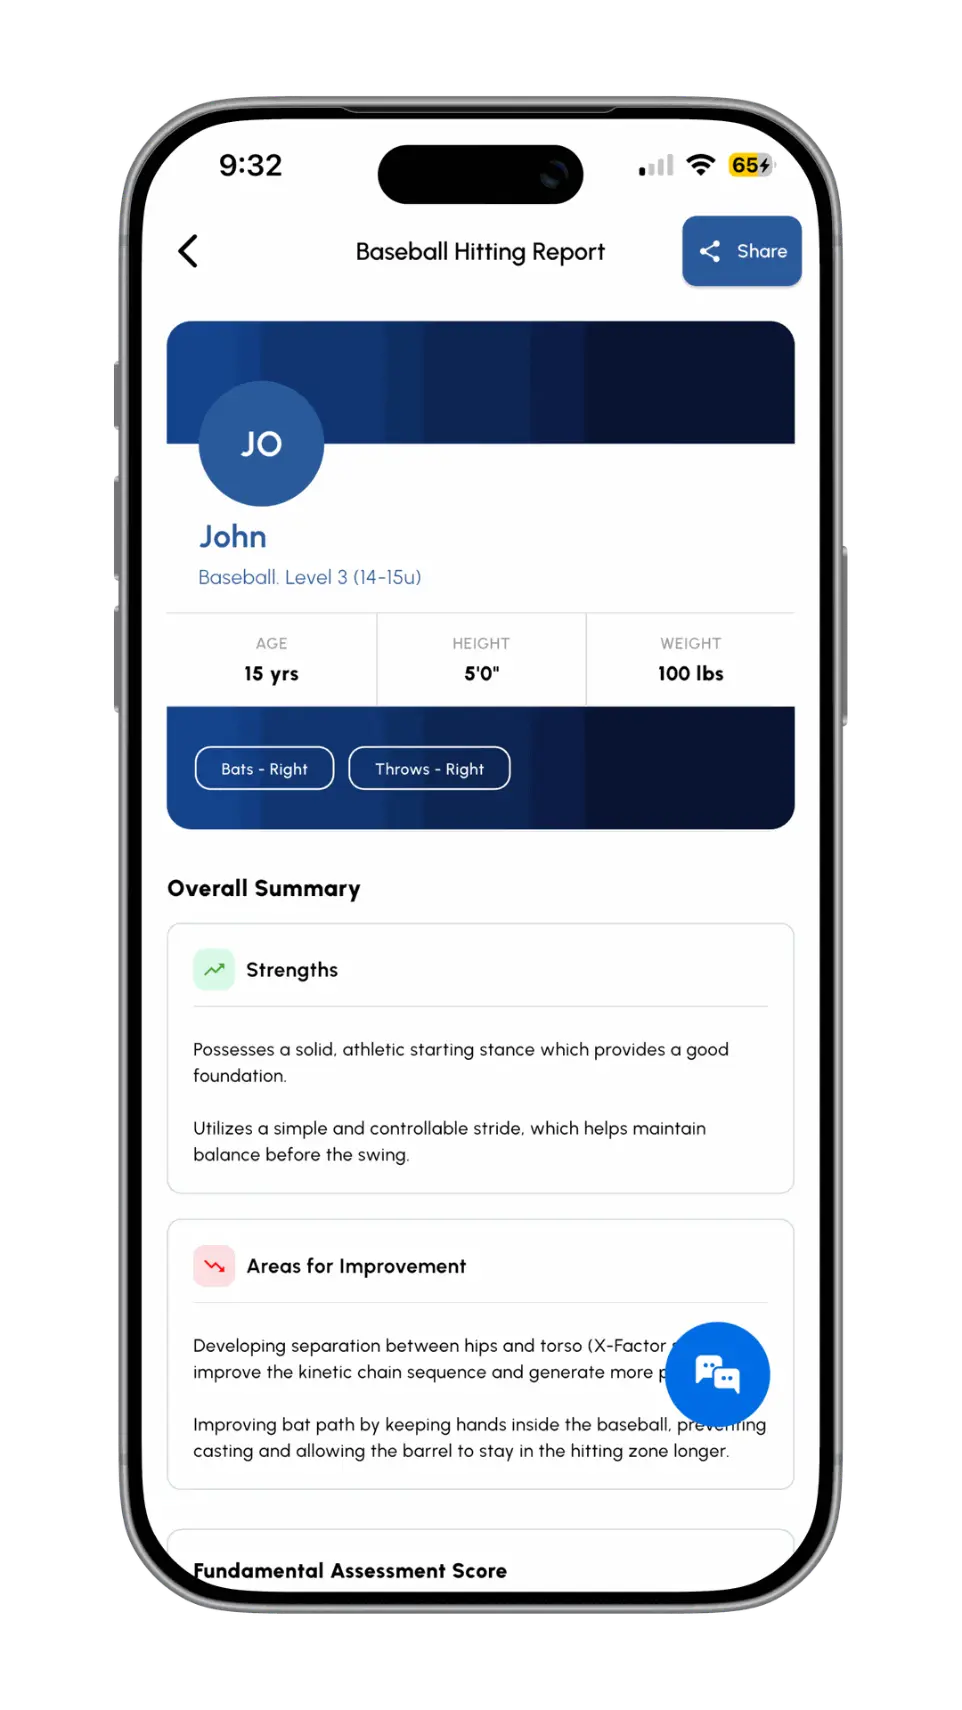
Performance Analytics Reports
Access detailed reports with key metrics and actionable insights for every athlete.
See Basketball Analysis in Action
Watch GameRunIQ analyze basketball gameplay with AI-powered insights on shooting, movement, decision-making, and player performance in real time.
See Ice Hockey Analysis in action.
Watch GameRunIQ in action as it delivers real-time feedback on gameplay video and analyzes biomechanics.
AI-Powered Performance Analysis
Watch how GameRun captures every play, delivers detailed analytics, and provides actionable insights to elevate player and team performance.
AI-Powered Injury Prevention
Can AI predict injury? This video shows how biomechanics flagged injury risk before it appeared on MRI.
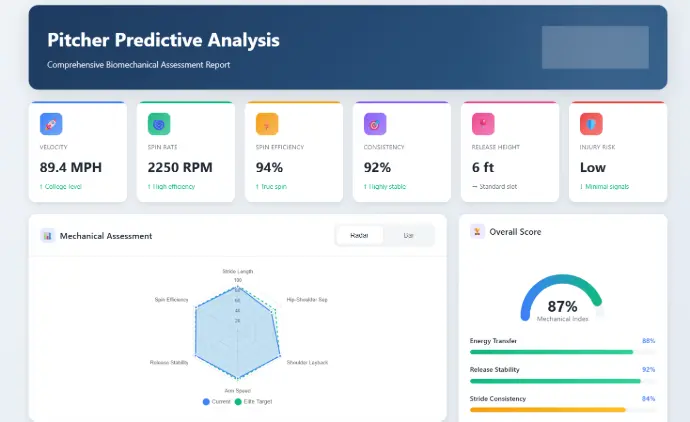
Pitcher Predictive Biomechanics
AI-powered mechanical analysis that projects performance, efficiency, and injury risk.